Used Vehicle Value Index
Quarterly Conference Call
The next quarterly Manheim Used Vehicle Value Index (MUVVI) conference call is scheduled for Tuesday, Jul 9 at 11am ET.
Join Cox Automotive Chief Economist Jonathan Smoke, Jeremy Robb, senior director of Economic and Industry Insights, and Scott Vanner, Economic and Industry Insights analyst, as they discuss the latest Manheim Used Vehicle Value Index and the major economic and industry trends that shaped the quarter.
All questions related to the Manheim Used Vehicle Value Index and wholesale market can be sent to manheim.data@coxautoinc.com.
Listen to a recording of the last call.
View the Most Recent Presentation
The presentation will be available one hour before the conference call.
View Previous Presentations
By applying statistical analysis to its database of more than 5 million used vehicle transactions annually, Manheim has developed a measurement of used vehicle prices that is independent of underlying shifts in the characteristics of vehicles being sold. View the index methodology.
The Manheim Index is increasingly recognized by both financial and economic analysts as the premier indicator of pricing trends in the used vehicle market, but should not be considered indicative or predictive of any individual remarketer’s results.
Wholesale Used-Vehicle Prices Decrease in First Half of April
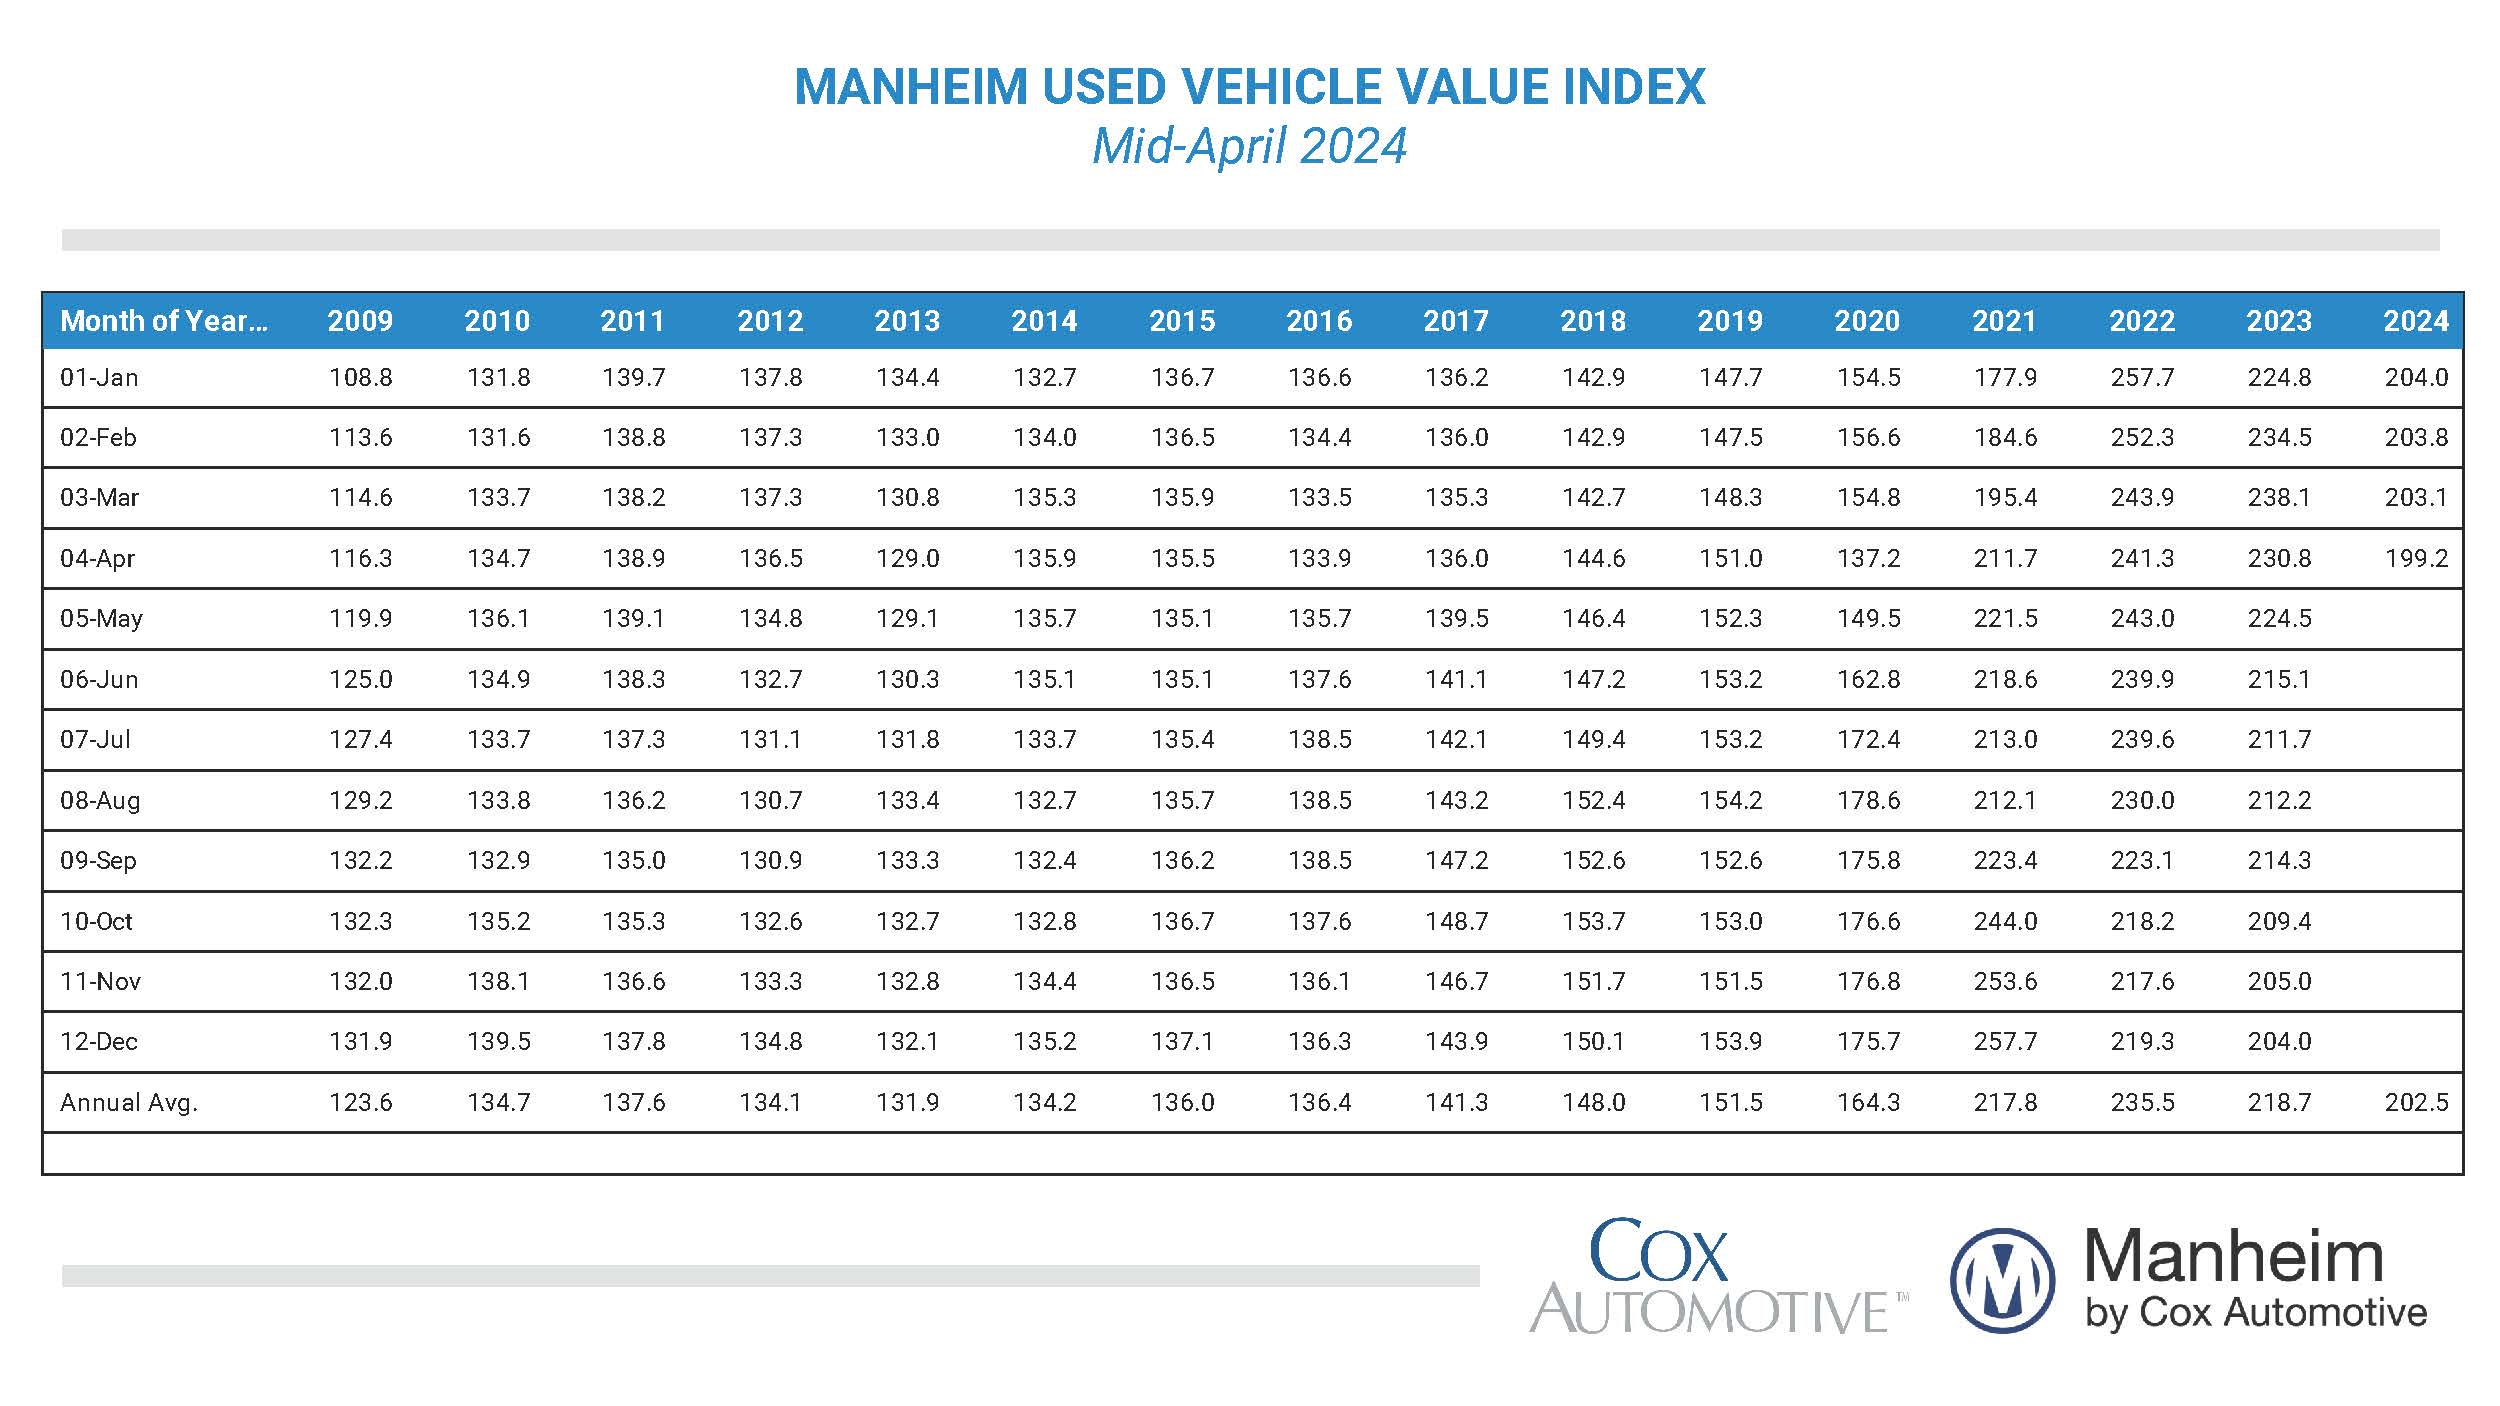
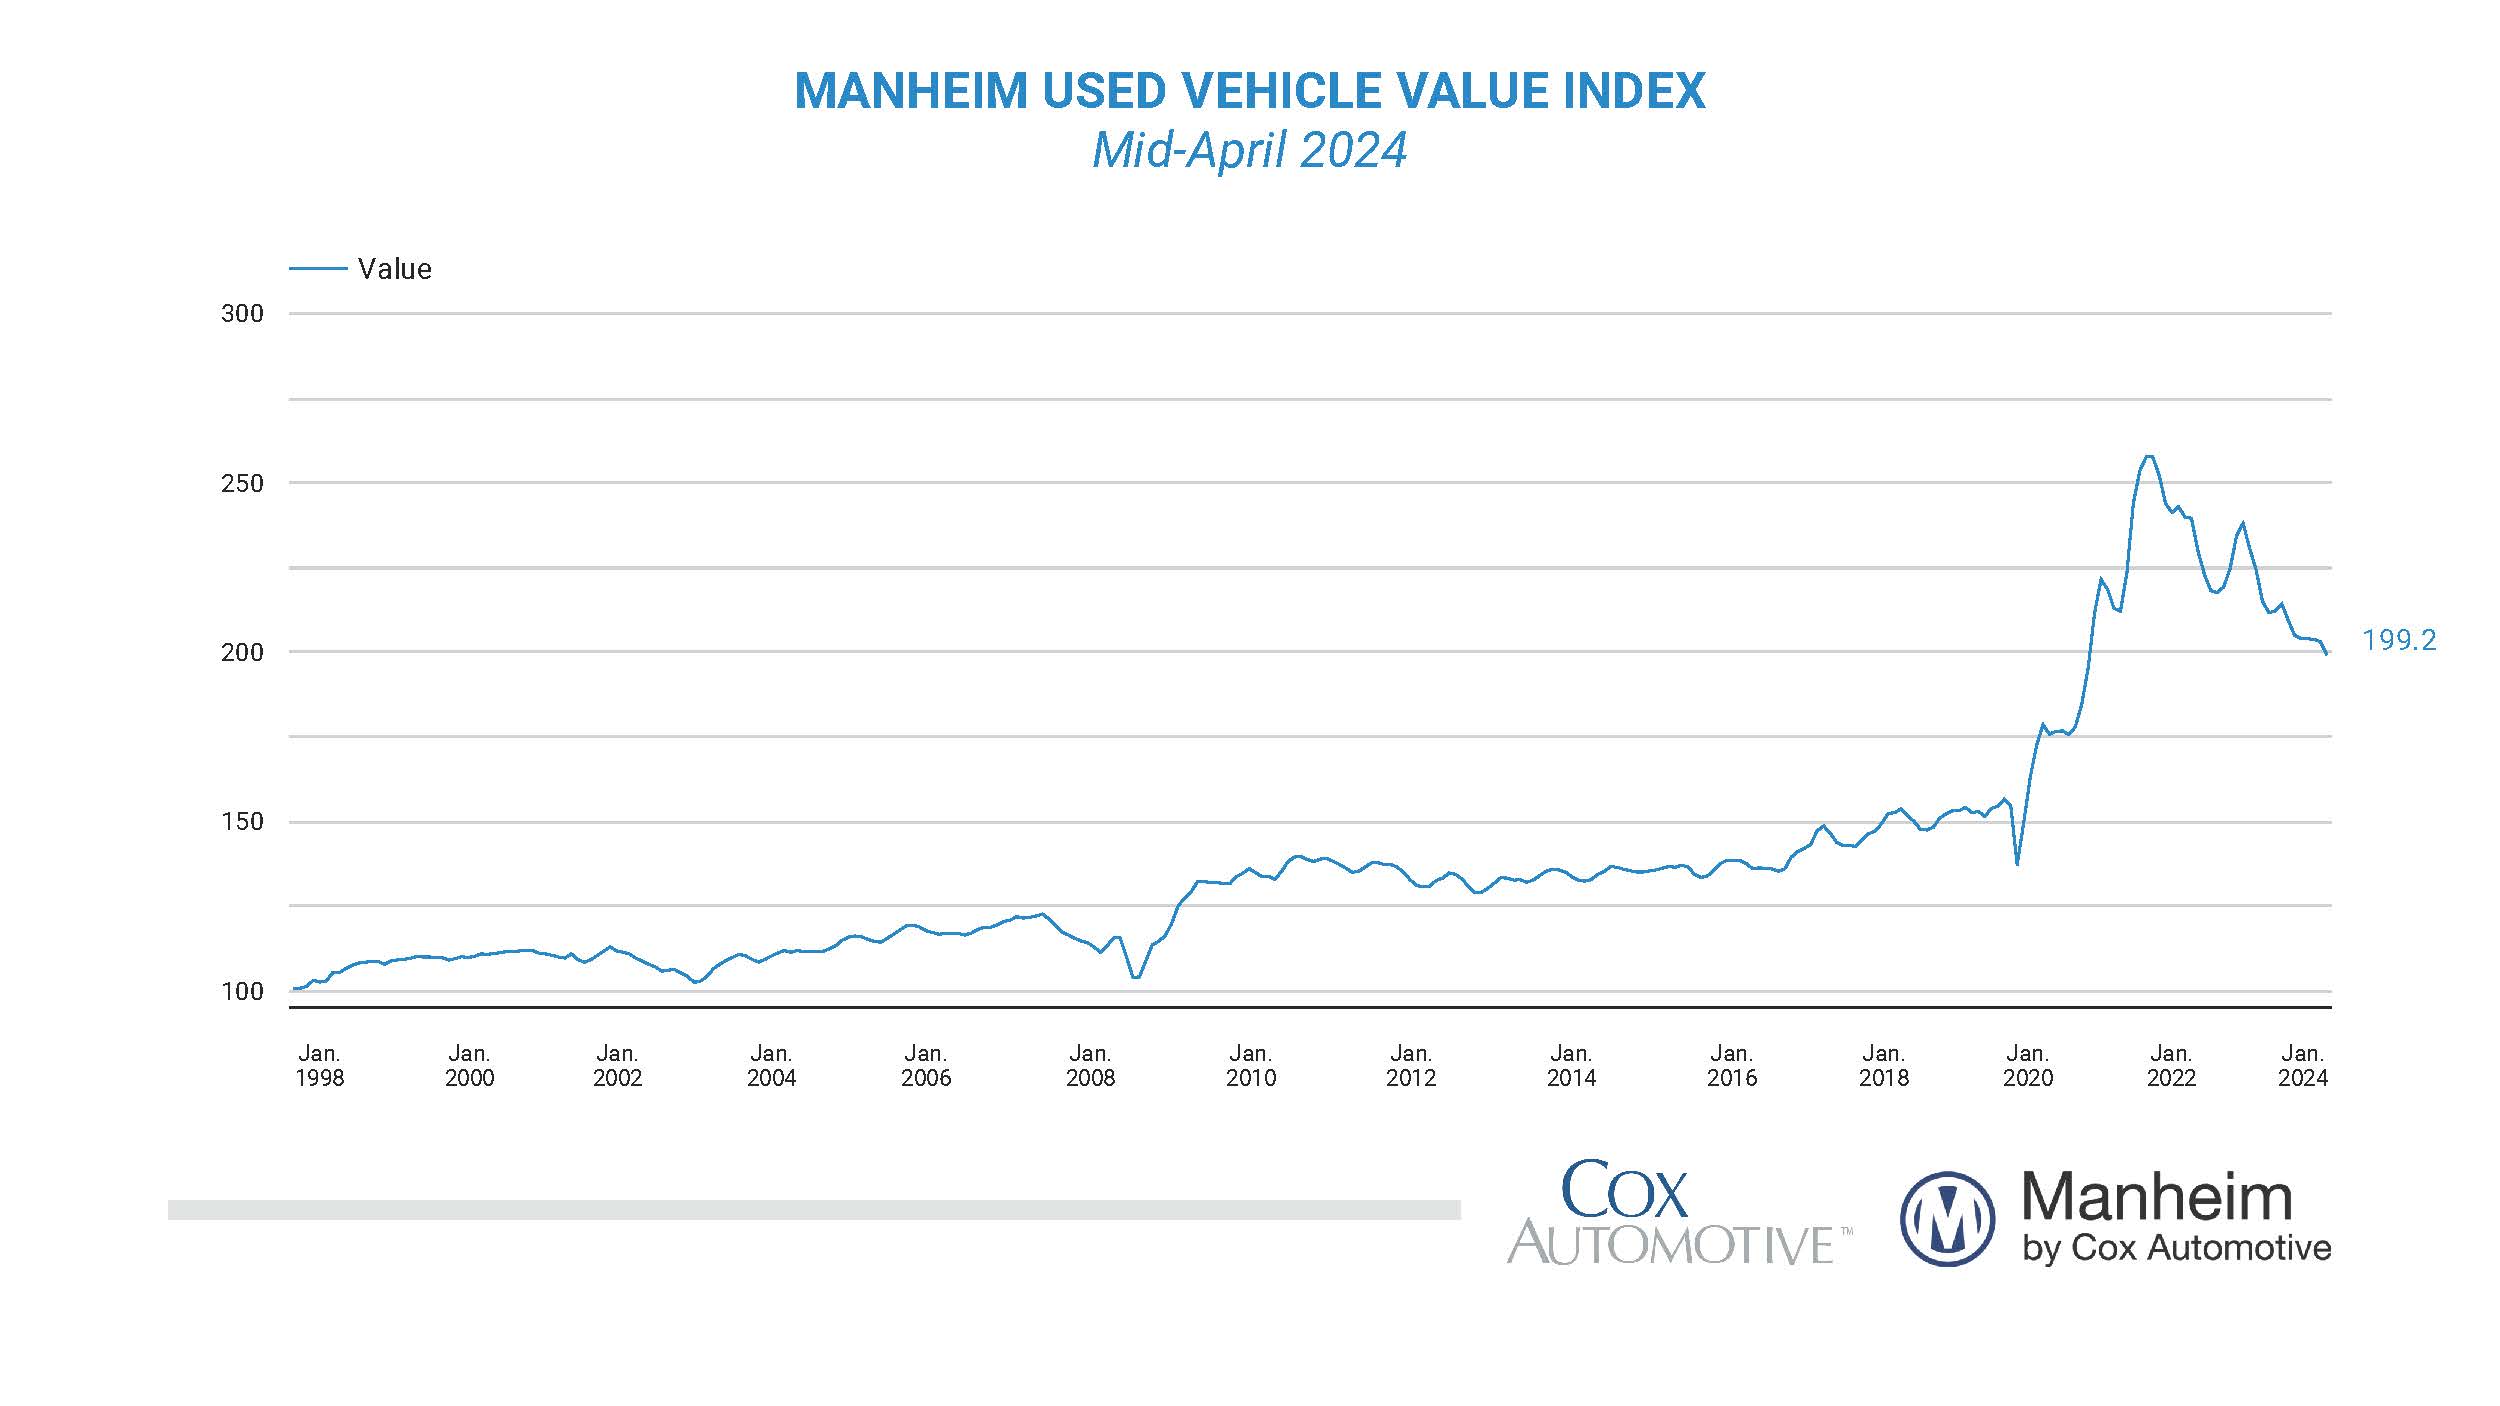
Wholesale used-vehicle prices (on a mix-, mileage-, and seasonally adjusted basis) decreased by 1.9% from March during the first 15 days of April. The mid-month Manheim Used Vehicle Value Index dropped to 199.2, which was 13.7% lower than the full month of April 2023. The seasonal adjustment amplified the results. The non-adjusted price change in the first half of April declined by 0.2% compared to March, while the unadjusted price was down 11.6% year over year. This was the first time the Manheim index reading has been under 200 since March 2021, illustrating the outsized moves in the index over the last three years
Over the last two weeks, Manheim Market Report (MMR) prices in the Three-Year-Old Index decreased an aggregate of 0.5%, which is higher than the typical 0.3% decline seen this time of year. Over the first 15 days of April, MMR Retention, the average difference in price relative to current MMR, averaged 98.4%, indicating that valuation models are a little higher against market prices. MMR retention is down six-tenths of a point against the prior year at the beginning of April. The average daily sales conversion rate of 61.1% in the first half of the month was below the April 2019 daily average of 63.6%. The conversion rate is down nine-tenths of a point from March 2024, indicating that buying demand has weakened as the spring market has progressed.
All major market segments saw seasonally adjusted prices that remained lower year over year in the first half of April. Compared to the industry’s year-over-year decline of 13.7%, luxury was the only large segment outperforming the index overall, down 12.7%. Performing worse than the industry, SUVs were down 14.0%, pickups were off by 15.0%, midsize cars fell by 16.0%, and compacts lost the most, falling by 17.1% year over year. Additionally, all major segments showed price declines compared to March. The industry overall was down 1.9% against the prior month, and pickups were the only segment outperforming, declining by 1.1% over the same period. Midsize cars declined by 2.1%, SUVs fell by 2.3%, luxury fell by 3.0%, and compact cars declined by 3.4% compared to March 2024. Electric vehicles (EVs) were down 18.3% against values for April 2023, while non-EVs declined by 13.1% over the same period. Compared to March, non-EVs declined by 3.1% in the first half of April, while EVs were down 3.6% over the same period.

Wholesale supply is down in mid-April. Leveraging Manheim sales and inventory data, we estimate that wholesale supply ended March at 23 days, down three days from the end of February and flat against March 2023. Wholesale supply continues to remain relatively tighter for this time of year. As of April 15, wholesale supply was up one day from the end of March at 24 days but flat year over year. However, wholesale supply remains down two days compared to 2019.
Rental risk prices remain mixed in first two weeks of April. The average price for rental risk units sold at auction in the first 15 days of April was down 11.9% year over year. Rental risk prices were up by 0.4% compared to the full month of March. Average mileage for rental risk units in the first half of April (at 57,500 miles) was down 3.5% compared to a year ago and up 9.6% month over month.
Consumer sentiment dropped in April. The initial April reading on Consumer Sentiment from the University of Michigan declined 1.9% to 77.9 as both future expectations and views of current conditions declined. Current conditions declined the most. Expectations for inflation in both one year and five years increased, following recent inflation data. Consumers’ views of buying conditions for vehicles fell to the lowest level yet this year but remained better than a year ago. Consumers’ views of both vehicle prices and interest rates deteriorated. The daily index of consumer sentiment from Morning Consult also points to a decline in the first half of the month that worsened over the weekend. As of April 15, that index has declined 2.2% for the month. The average price for unleaded gas has increased by 3.1% so far in April according to AAA. At $3.64 per gallon for unleaded as of April 15, gas prices are up 17.2% year to date and at the highest level since early October 2023.